




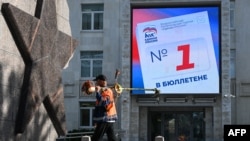
Russia just held its first parliamentary election since launching its full-scale invasion of Ukraine in February 2022.
For the first time in a State Duma election, Russian authorities set up balloting boxes in four Ukrainian regions partially occupied by Russian troops and claimed by Moscow as Russian territory.
Other than that, the election felt familiar. The Kremlin-linked ruling party, United Russia, won. And it won big, enlarging its super majority even further in the 450-seat Duma.
The dodgy voting patterns underlying United Russia's win, observed in previous Russian parliamentary and presidential elections, are familiar too.
Independent observers, including Golos, a prominent Russian watchdog, have been shut out, making it difficult to verify the integrity of the vote.
But look at tried-and-true statistical analysis of the voting patterns and you can see that, in all likelihood, United Russia got millions of votes above what the statistical model would predict.
The method, invented by Russian data analyst Sergei Shpilkin, compares turnout and voting patterns across polling stations to identify results that depart from the broader national pattern.
In a normal scenario, if you look at results for the country as a whole, turnout at any specific polling station should not be a strong predictor of which party received more votes at that polling station.
But over three days of voting last weekend, polling stations with higher turnout tended to report a much higher result for United Russia.
Election results across polling stations should form a roughly bell-shaped cluster, with most stations grouped around a typical result and fewer at the extremes. In this election, United Russia’s results do not follow that pattern.
Look at a chart showing United Russia’s vote share at individual polling stations plotted against how common polling stations with that vote share were. You see two peaks instead of one.
That first, smaller curve represents the estimated “honest core” of United Russia’s result -- polling stations where United Russia’s share of the vote doesn’t look suspicious to the statistical model.
Polling stations outside of that curve make up the tail of the “comet” that United Russia’s result forms on the chart below, with higher turnout at a given polling station usually also predicting a higher result there for United Russia. If you click through the other parties, you’ll notice none of their results form a similar shape.
Shpilkin’s method estimates how many votes United Russia would have received if higher turnout had not come with unusually strong support for the party. The difference between that estimate and the official result gives an estimate of the votes that may have been added through ballot-stuffing.
According to RFE/RL’s analysis, that number comes out to some 18 million votes. Without those extra votes, United Russia would have received about 35 percent of the vote.
Instead, they officially received 57.8 percent of the vote, according to results released by the Central Election Commission with 90 percent of ballots counted.
The analysis can identify results that look statistically unusual, but it cannot show exactly how those extra votes were produced; for example, if the ballot boxes were stuffed or there was some other type of voter fraud. The model also depends on which polling stations are used as the baseline for a normal result.
But the scale of the gap is substantial.
The same statistical signature -- that is, unusually high turnout at a polling station coupled with unusually high support for the ruling party -- has become a recurring feature of Russian elections.
It's almost certainly why United Russia "won" a majority in this election.
Note on the data: The charts are built from precinct-level protocols for Russia's State Duma party-list vote of September 17–20, published by the Central Election Commission and collected by Pyotr Zhizhin at deg.zhizhin.xyz. RFE/RL took a fixed copy on September 23 at 10:48 Moscow time, so nothing the commission published later is reflected here. Moscow and online voting are left out, as are a few regions the commission had not yet reported.

